


Markets Discussion Part 3: 10yr T-note Yield vs US Dollar
How do Trump tariffs correlate with the trajectory of the US dollar? Time will clarify.

There are only two data points for Trump tariffs and what happens with the US dollar and the 10-year US Treasury note yield. Here they are.
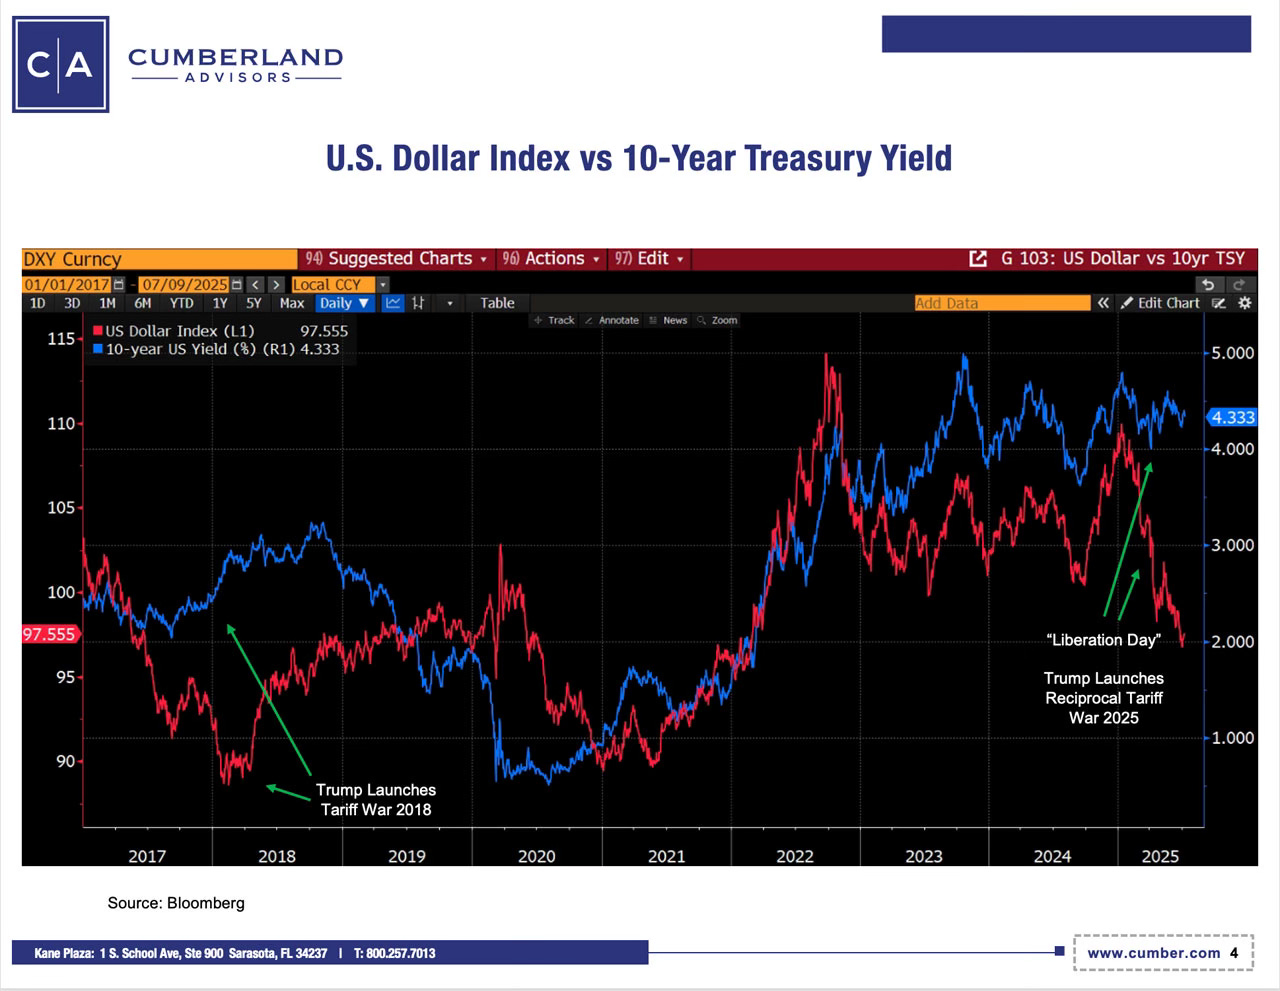
(Source: Bloomberg, chart courtesy of Cumberland Advisors)
These two case studies offer evidence of coincidence. But there is no proof of causality. That is still a speculation. Today, we watch the trending weakness of the USD. The chart above depicts what happened in Trump’s first term and what has happened so far in Trump’s second term. Will the trends reverse in Trump 2.0 as they did in the previous Trump term case study?
Note that these are market-based prices reflected in the US Dollar Index, so they reveal outcomes. Causality is a subject of debate, and with only two data points we cannot obtain any probabilities that are worthy of acting upon.
We also note that Trump’s first term had the largest single-presidential-term increase in federal debt in American history. Biden’s term was the next largest. The federal response to the COVID pandemic emergency, of course, played an enormous part in the debt increase under Trump and Biden. Changes in the tax code also contributed. Now we are in Trump’s second term, and the outlook is that the Trump 2.0 cumulative federal debt increase will exceed that of his first term.
The tariff wars initiated by Trump 1.0 and Trump 2.0, noted in the chart, have impacted the strength of the dollar each time. The red line on the chart shows the weakening of the US dollar (DXY) coinciding with the tariff announcements.
But, but, but… We cannot say that tariffs are the only factor. Nor can we say the expansion of federal debt is the only factor. Many things can alter the trajectory for any currency and especially the US dollar. The same is true for interest rates.
The debt issue was discussed in Part 2 of this series, “Composition of Debt” (https://kotokreport.com/markets-discussion-series-part-2-composition-of-debt/), without my drawing a conclusion about the composition of debt. I have no best guess about how this eventually ends. Intuitively, I surmise that rising debt aggregates mean an increase in debt burdens. But if the composition questions we discussed in Part 2 are applicable, we don’t have a rising debt burden in the aggregate debt to GDP, only in the federal debt to GDP.
So why is the US dollar’s weakness driven by tariffs? Will that weakness reflect a temporary adjustment as it did in Trump’s first term? Or is there a regime change trending? Is the US dollar destined to become much weaker? Today, the honest answers to these questions are “I don’t know.”
I’ll have more to say about that in part 4 of our Markets Discussion Series.