


Discussion of Markets Series Part 2 – Composition of Debt
As the federal debt-to-GDP ratio is set to soar, is it federal debt to GDP or total debt to GDP that counts?

We thank Philippa Dunne and Doug Henwood of TLR Analytics (
https://www.tlranalytics.com
) for giving us permission to share an excerpt from a recent discussion about debt and markets in TLR on the Economy. TLR raises a question that bond investors can consider. Is it federal debt to GDP or total debt to GDP that counts? If total debt to GDP is stable, then the internal components of debt matter for investors, but the macroeconomic debt burden is the same. Or is it?
When we ask practitioners this question, the answers run the gamut of possibilities. Some say only federal debt matters. They cite the fact that the central bank’s monetary policy focuses only on federal debt and specifically Treasury debt. That is true today. But, but, but…
Counterarguments note that during the 2008–2009 financial crisis and the COVID crisis, the Fed moved policy applications out of Treasury debt when it determined that it had to do so to maintain systemic financial stability. Others argue about the total debt aggregate and point to the total “debt burden” as the important metric. We will publish more on this question when we cite some work by Barry Bannister, Managing Director and Chief Equity Strategist at Stifel. But, but, but…
Fed-focused market agents respond by saying that central banking is dealing only with federal (Treasury) debt now, and the Fed is even trying to work its way out of federal agency debt by letting the mortgages run off. They argue that the Fed cannot sell the mortgages because it would have to realize losses and because doing so would negatively impact the housing market by forcing the mortgage market to absorb the Fed’s sales. So, runoff is the only practical option. But, but, but…
Credit-spread analysts note that spreads of corporates to Treasury debt are tight. A question follows: Why? Is it because the US economy is so strong that credit risk is diminished? Or is the tightening of credit spreads coming from the Treasury side because of large forthcoming Treasury debt issuance following passage of the OBBBA? Perhaps it is the Treasury side that is causing the tight spreads because of the growing federal debt-to-GDP ratio. But, but, but…
Note that the municipal debt-to-GDP ratio has been consistently falling. Sovereign states, cities, and counties collectively have been issuing debt at a slower pace relative to GDP. And note that nearly all of them have balanced-budget requirements.
So, the debate continues. Let’s add some expertise.
In this excerpt from the June16 edition of TLR on the Economy, “Fewer firms, bigger firms,” Philippa and Doug examine debt-to-GDP ratios for nongovernmental sectors vs. for the federal government:
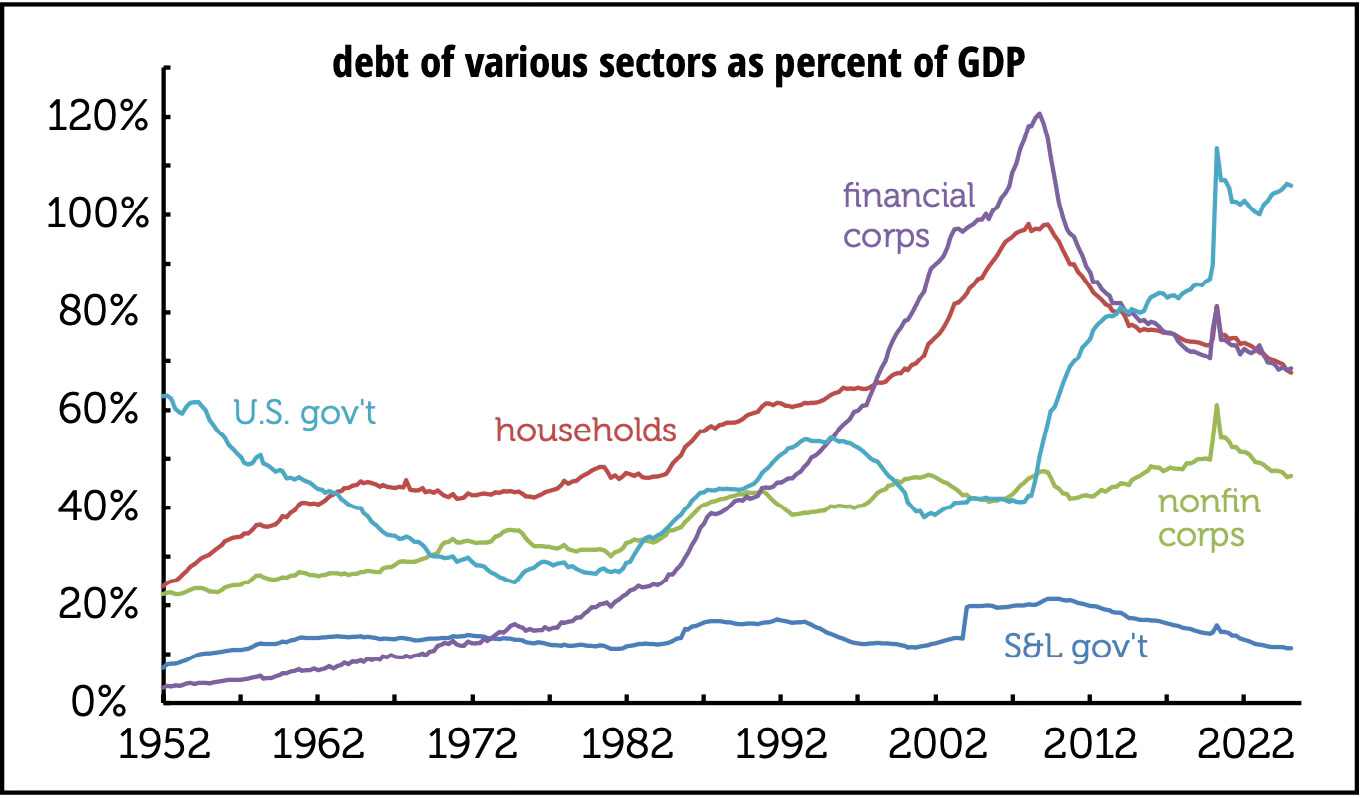
Yet another quarter where most sectors—aside from the federal government—saw their debt/GDP ratios decline [first graph below), many to their lowest levels in a long time. The household ratio hasn’t been this low since 1999; state and local government, 2000; and financial firms, 1998. Nonfinancial firms’ ratio, which had been something of an exception to the general post-financial crisis deleveraging trend, are where they were in 2015, but before that, you have to go back to 2001 to find a lower ratio. Put all the major sectors except the federal government and financial firms together, and we’re at the lowest ratio since 2001 [second graph below]. We often bracket financial firms, since they’re mostly intermediaries, who borrow to lend, and therefore reflect developments in other sectors. Their ratio has a correlation of 0.97 with the nonfinancial/ nonfederal aggregate.) For the older among us, who remember decades of often passionate worry about the US economy’s dependence on perpetually higher borrowing, this is quite the change.
There is a big exception to this trend—the federal government.
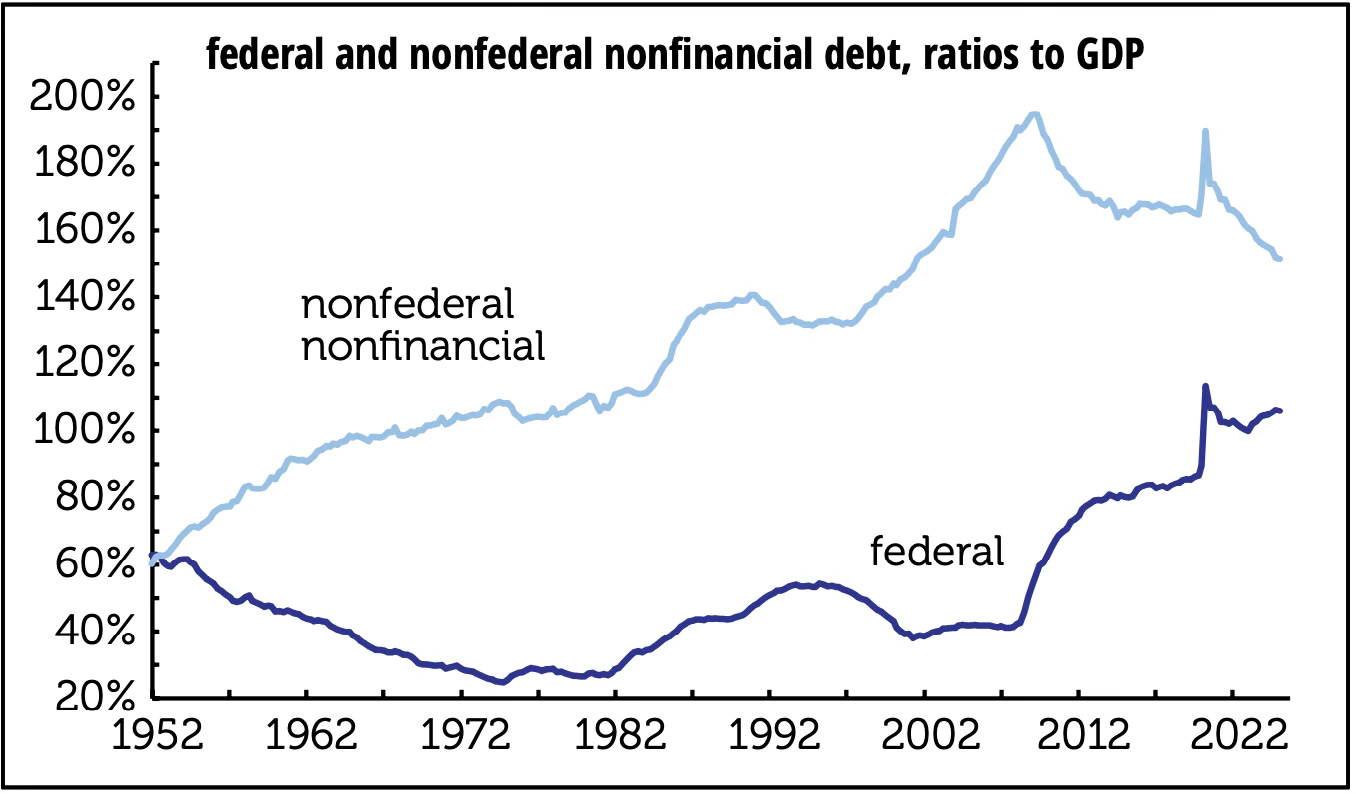
Weirdly, the historical tables for the federal budget have disappeared from the White House website, but by the Congressional Budget Office’s accounting, which differs some from the Fed’s in the financial accounts, the federal debt/ GDP ratio is now just slightly below where it was at the end of World War II—but the interest burden is more than twice as high now as then. (Long Treasuries yielded 2.4% in 1945, compared with 4.25% on the 10-year today.) In 1945, we were coming out of four years of all-consuming war following a decade of depression. In 2025, it’s not clear what we have to show for all this borrowing—with far more to come. But at least private sector balance sheets are looking robust.
Kotok note: We don’t have the answer to this question of federal debt versus total debt as a ratio to GDP. We do know that federal debt is going to rise faster than the expected growth rate of the economy, so that the federal debt-to-GDP ratio is going to set new records above the peak it reached at the end of WW2. Whether that ratio “crowds out” other borrowers remains to be seen. Anyone wonder why the White House website stopped reporting the debt data? Maybe Russell Vought knows the answer.